4: Nginx Logs
This was a web compromise, which means the attack had to take place over, y'know, the web. WhisperWolf's WordPress site was served using the Nginx webserver, which our SIEM has logs for. Let's take a look at just the Nginx logs by selecting that dataset.
Elastic Setup
In Elastic, find the the data_stream.dataset field in the field list (it should be right up top 😉). Click on it, the click the + next to the nginx.access dataset to select only those logs.
Then, make sure we're looking at logs for the last 20 days.
In the timechart of events, one day should look a little larger. Make a note of it.
Let's get some useful columns. If we expand just one of the documents from this dataset, we'll see quite a few fields. The good stuff doesn't start until h. Using either the field list on the left, or the toggle buttons in the document itself, display these fields in our document list:
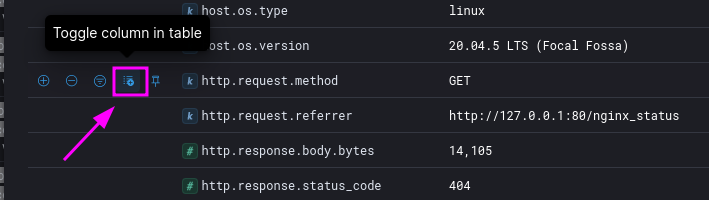
http.request.methodhttp.request.referrerhttp.response.status_codesource.ipurl.pathuser_agent.original
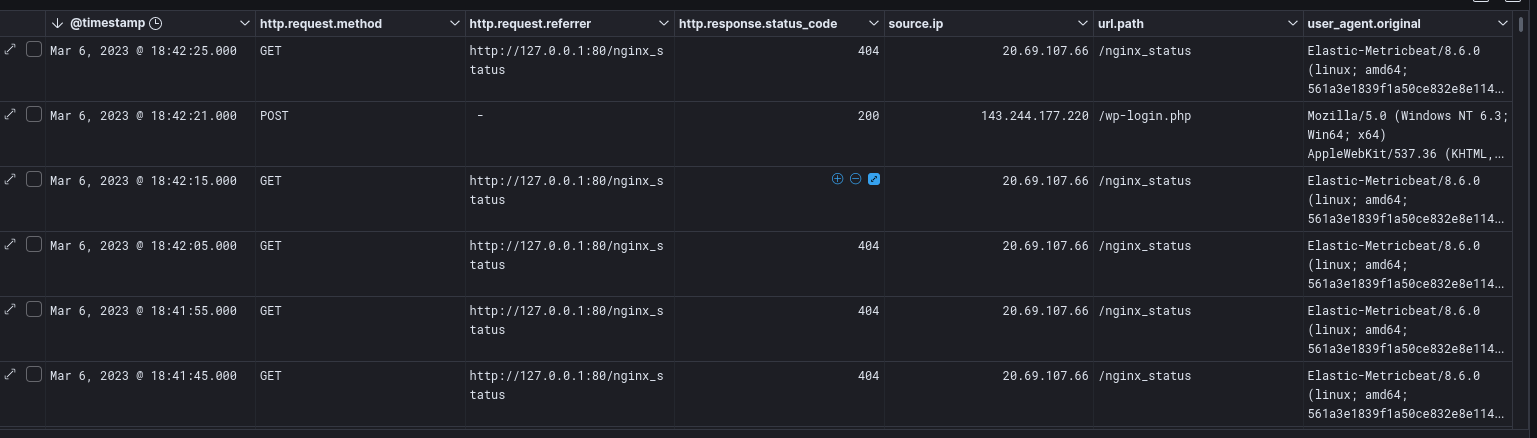
When you're done, your document list should look a little like this:
Filtering Data
This is a webserver on the internet. There's going to be a TON of data we don't need.
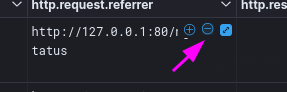
As a matter of fact, it looks like there's a lot of noise coming from the server itself. An examination of the http.request.referrer column shows quite a few requests from http://127.0.0.1. That's...unhelpful. Hover over one of those values and click the - to filter that value out of our results.
Check out the timechart now. Boy, that clarifies matters, huh?
What day shows a major spike in HTTP requests?
Click on that day to filter to just those requests. Your timechart will update to show events hourly.
What hour shows a spike in HTTP requests?
Analyzing data
When investigating an incident like this, our first step is to look for anything anomalous. In volumetric analysis, we are simply looking for abnormal amounts of things—in this case, HTTP requests. It sure looks like we found a blip!
This version of the timechart shows events in 10-minute bins. Click again. You should no longer see a single spike. You've found the large burst of activity.
When did the activity burst start?
When did the activity burst end?
Click and drag over the block of events to filter just to that time period. If you make a mistake, click back in your browser and try again.
The Burst™
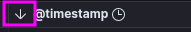
Your events are ordered newest-first. Click the timestamp column heading to flip it to ascending order (oldest-first).
Look carefully at the timestamps. Could a human being have been doing this?
Using filters, answer the following questions:
How many requests for wp-login.php were there in this timeframe?
How many requests were NOT response code 200?
What is the source IP of these events?
With this information, what do you think is happening here?
Hint: WordPress has a weird login quirk. Failed logins results in a response of 200, but successes are redirected (302) to wp-admin.php.
SPOILERS
" WARNING: SPOILERS AHEAD
"
"
"
"
"
"
"
"
"
"
"
" DO NOT PROCEED UNLESS YOU WANT SPOILERS
"
"
"
"
"
"
"
"
"
"
"
" I MEAN IT. LAST CHANCE
"
"
"
"
"
"
"
"
"
"
" OKAY, HERE WE GO.
After the Burst
If, as we suspect, the attacker guessed the login password via a dictionary attack, their next steps once logged in will be crucial to understanding the investigation. Modify the view to look at what happened from our attacker's IP directly after the burst.
The admin dashboard has a lot of assets to request, making for a lot of GET noise.
It would be common for an attacker to attempt to make changes at this point, which would require sending data to the server. That would be a POST or PUT request. Filter GETs out of your data and see what remains.
What files appear to have been edited by the attacker?
Corroborating our Data
I know we're in the Nginx Logs section, but we now have specific files that have been referenced! See if you can find those files now in VS Code.
What appears to have been added to these files?
What does this code do?
Filling in Gaps
Extend your time range a bit—perhaps to 23:00. Take a look at the requests that come after the ones we've already seen. Anything jump out at you?
What new files are being requested?
What da—how did those get there?
(You can see one of these in the webroot right now, but we'll tangle with that later.)
It really seems like somehow, the attacker was able to drop new files onto the system. That's weird though, because WordPress doesn't let you create new files through the admin dashboard; it only lets you modify existing files—as we've seen.
We're missing something.
Let's go back to what we know. What files were modified? Do we see them getting accessed?
Well...kinda. One of the files that was modified doesn't return a 200 when visited. Let's examine those requests more closely.
What is the url.path the attacker used to access the infected PHP?
Okay so this is suspicious, but as we're looking at things now, we're still missing something. Let's pop open one of these events to look at all the fields.
I'd pay especial attention to the url.* fields.
If you find a field that seems to have more information, add it to our listed fields.
Whoah! Hello there. Looks like the attacker achieved remote code execution.
What command did the attacker execute to create the first mystery file?
Zooming Out
Remove the HTTP Response Code filter you have on, if any. Let's move forward in time a bit.
It looks like toward the very end of the day, the attacker was mucking about in another part of the admin dashboard.
What other action did the attacker undertake in the admin dashboard?
SPOILERS
" WARNING: MORE SPOILERS AHEAD
"
"
"
"
"
"
"
"
"
"
"
" I FEEL LIKE YOU'RE NOT TAKING ME SERIOUSLY
"
"
"
"
"
"
"
"
"
"
"
" IT'S NOT A GOOD FEELING BEING IGNORED
"
"
"
"
"
"
"
"
"
"
" FINE HAVE IT YOUR WAY
Ah ha! This appears to be what the site administrator originally reported. Now, we could have gone looking for this first—and if we hadn't found anything via our initial investigation methods, we would have. But I always prefer to take the wide view first and see if I can arrive at the original evidence. I often discover much more by invesigating this way rather than starting at the end.
But we're not done. Oh no, far from it. Although this seems to be as far as the Nginx logs can take us, we have 2 other rich sources of information. Let's cross-reference the web activity with what was happening on the system with our Syslog data.